Blog: Centria’s SmartCampus and IoT
| Edited blog | Smart Campus Insider |
| Date | 04 April 2022 |
| Authors | Markus Liuska, RD-Specialist |
| Keywords | SmartCampus, IoT, Centria |
| Permanent address | https://urn.fi/URN:NBN:fi-fe2022041929475 |
| Citation |
Abstract
There are already billions of IoT-connected devices around the world and based on a forecast from Statista [1], this trend will continue to grow both in the industrial and consumer fields. While this creates possibilities for new products and services, it also contains pre-existing challenges, such as platform fragmentation and lack of standardization [2].
In Centria University of Applied Sciences’ projects, we commonly need to utilize more than one manufacturer’s devices or systems, including our own custom-made solutions in our demonstrations. It creates the challenge of understanding the device’s physical location and connection to the real world. The IoT platforms generally solve these challenges by tagging, GPS position, or custom naming. Sadly, these solutions are not always interoperable between platforms. Because of this, we at Centria have looked for a platform-agnostic solution for collecting different systems together while having meta-information about the devices or things placed in the real world.
Centria’s IoT Information Model
In the SmartCampus project, Centria is trying to tackle this challenge with the concept of the IoT Information Model (IoTIM). The purpose of the model is to present things and their connections within the real world. A thing in the model can be a device, a building, a room, or anything that has a role within the model’s scope.

For creating a model, the defined things must be connected together in a meaningful way. For example, a sensor is located in a room and a room is inside a building that is located in a city. As the IoTIM does not enforce any restrictions on how things are connected, it is possible to create rather complex structures based on the use case.
Just mapping the connections between things would not be particularly useful by itself. Because of this, each thing has a feature information that explains the necessary information depending on the purpose of a thing. Sensor type of a thing would contain information about the value and how to access it and a generic room would contain information about the dimensions of the room. While details of the room’s dimensions might at first glance seem to be unnecessary, they could be useful for analytical purposes depending on sensors. For example, using a CO2 sensor could allow us to estimate the number of people within a room as the total volume of the space is known.
As the things can be connected freely, the model’s structure forms a graph, where a thing can be seen as a node and connection as an edge. This allows us to store the IoTIM model within a graph database for providing flexible querying that could allow searches such as “get all sensors within a building in the city” and because the model can be extended with new things, we can create applications that can automatically utilize new information added within the model.

Making booths smart with IoTIM
Like many companies nowadays, Centria has different sizes of conference booths on our campuses for allowing people to have a quiet place for meetings, phone calls, and teleconferences. These booths are quite popular and finding a free booth can be sometimes challenging as a person needs to physically go and check if the booth is occupied or not, especially in unexpected needs.

As we needed a practical use case for demonstrating and testing the IoTIM model, we decided that we could try to help people with this challenge and, at the same time, get experience from using IoTIM in a real-life case scenario.
For detecting if the booth is free or occupied, we needed to find a suitable sensor. After brainstorming, researching, and testing the most potential ones, the CO2 sensor seemed to be the best choice for this use case. It was a relatively economical choice and because these booths have electrical ventilation, it allowed us to place the sensor on the booth’s exhaust vent. This meant that we could avoid taking any space from inside the booth and powering the device from the same electric socket that the booth uses.
As the hardware, we placed Raspberry Pi Zero single-board computer and Senseair CO2 sensor into a casing with drilled holes for ensuring airflow.

For allowing the CO2 level to be accessible via IoTIM, we developed a client application that reads the sensor and periodically sends the mean value to Centria’s Foam-platform. The platform stores this data as time series for each CO2 sensor and allows sharing the information with other services.

We are still testing different ways of detecting if one or more persons are inside the booth. For now, we are using a simple threshold check, where the booth is occupied, when the CO2 level exceeds a certain value.
After we had information about the booth’s CO2 output level, we added the sensor and the booth as separated, but connected things within the IoTIM model. This allowed us to develop a service called SmartBooth. This service uses IoTIM for automatically finding any booth within Centria’s campuses that has CO2 sensor (thing) connected. When a new booth matching these criteria is found, a new thing called smart-booth is added within the IoTIM model and is connected to the booth.
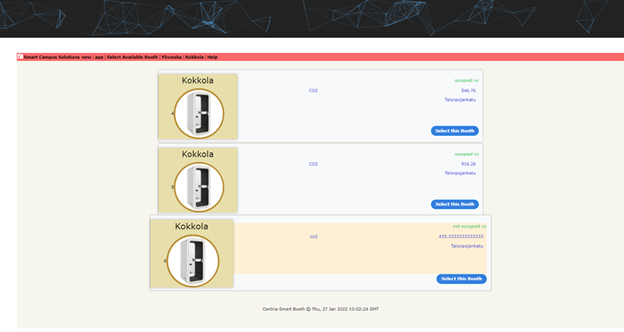
As we now had a thing that can be used for checking booth statuses, we developed a web application that allows users to list and check the booth statuses from selected campuses. In addition, if there are other sensors in the booth, such as temperature, these values are also shown in the application. They can also be used to help the user to choose the most convenient location for the meeting.
Future possibilities
Helping people to find free booths is a good start for utilizing IoTIM in a practical scenario. However, IoTIM’s design’s real value is in its extensibility. Adding new things into the model creates unforeseen possibilities for developing services and applications.
When developing an application that uses the same concept, but instead of booths using meeting rooms and spaces, we can also include the information from the smart-booth things. IoTIM could be used for analytical purposes as well. Answers for questions such as “Are there enough booths?”, “Is the usage spread evenly for each booth?” could be answered, even if it wasn’t the original aim for installing sensors.
References
[1] https://www.statista.com/statistics/1183457/iot-connected-devices-worldwide/
[2] https://www.qualcomm.com/news/onq/2016/02/19/fragmentation-enemy-internet-things
| Smart Campus Insider in an edited blog focusing on intriguing topics, project highlights and latest research results of the Smart Campus expert team. The blog writings are original contributions stemming from the latest research, innovation and development work of eight Finnish universities forming the project consortium. Each blog writing has undergone a review process by the editorial board. |